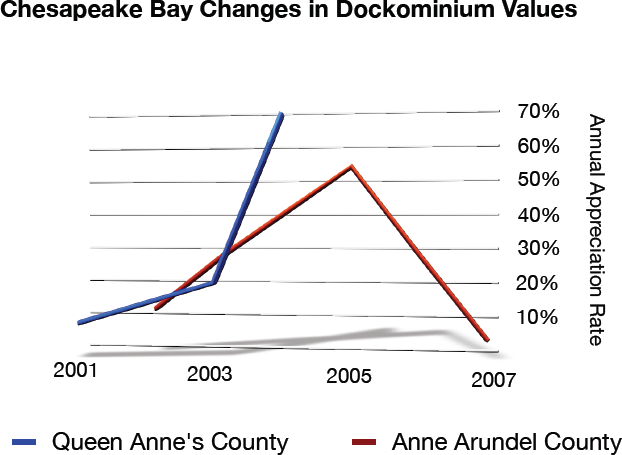
So given the nice, pretty charts in Part 1 and Part 2, what conclusions can we draw about the Chesapeake Bay dockominium market? Lets combine the data and pick out the patterns. Surprisingly, it.
Read moreAbout: John Simpson
Recent Posts by John Simpson
Wild Swings in Dockominium Values – Part 2 of 3
Comments are closed
Posted by John Simpson
Not to be outdone, let's try the same process that I did in Part 1 for Anne Arundel County, Maryland. Together, Queen Anne's County and Anne Arundel County comprise almost all the dockominiums on the Chesapeake Bay, although Anne Arundel County has several times more dockominiums than Queen Anne's. So let's see what happened with.
Read moreWild Swings in Dockominium Values – Part 1 of 3
Comments are closed
Posted by John Simpson
I live along the Chesapeake Bay and I got to thinking (a dangerous thing, naturally)... what if I used my analytical skills and took our database of dockominium sales and combined them with the Maryland State Department of Assessment and Taxation's data? Could I do some fancy number crunching? What patterns in dockominium values would.
Read moreRecent Comments by John Simpson
No comments by John Simpson yet.